Bitcoin Halvings & Future Bitcoin Price Prediction - 2024 Halving (Before & After) & 2025
With the 2024 Bitcoin halving countdown well and truly underway, this is a deep dive into Bitcoin halving events and our Bitcoin price prediction.Can Halvings Data Allow Us to Make a Sensible Bitcoin Price Prediction?
Introduction
On 6th September 2023, we published a mega article titled ‘Detailed Analysis of Projected Bitcoin Prices During 2023, 2024, 2025 & the Impact of the 2024 Halving‘. Coming in at a whopping 10K words or more, the article was intended to explore every aspect relating to Bitcoin’s price movement. The feedback we received was that the article was too much to digest, so we decided to split the article into a series of smaller guides covering the topic from different angles.
This guide titled ‘Bitcoin Halvings & Our Future Bitcoin Price Prediction – 2024 Halving (Before & After) & 2025‘ is part of the series focusing specifically on the importance of Bitcoin halving events and how these impact the price of Bitcoin and the wider impact on the crypto market.

Bitcoin halving events and BTC price prediction
Why is this important? The next Bitcoin halving date is expected in April 2024, roughly five months from now. This event marks a pivotal moment in predicting the BTC price. Historically, these events have had a significant impact on Bitcoin’s price along with the entire crypto market.
While Bitcoin halving events aren’t the only factor in shaping the price of Bitcoin, they are one of the most important. We’ll come on to other factors in the articles below, but in the last month alone we have seen a massive BTC price increase of 36% – and without a doubt – the next Bitcoin halving event is playing a considerable role.
If you would like to jump to one of the articles, please visit below:
- Bitcoin Price Models Compared & Their Accuracy: Is Bitcoin a Bargain?
- External Factors that Impact The Price of Bitcoin: Influencers & Influences
- Bitcoin Adoption, Holders & Power Players: Can Bitcoin Make Millionaires out of Randomers?
What is a crypto halving event?
In the world of crypto mining, a “halving” refers to the reduction of mining rewards by half. Miners validate and add transactions to the blockchain, and in return, they receive a reward in the form of the cryptocurrency they’re mining. Periodically, to control the total supply and combat inflation, this reward is cut in half, making the cryptocurrency more scarce and potentially more valuable.
What are Bitcoin halvings?
Bitcoin, the pioneer and champion of all cryptocurrencies undergoes a halving event approximately every four years or 210,000 blocks.
This process, known as the Bitcoin halving, directly influences Bitcoin price forecasts.
The event ensures that only 21 million Bitcoins will ever exist, preserving its scarcity. Since its inception in 2009, we’ve had three Bitcoin halving dates, in 2012, 2016, and 2020. Each time, the reward for mining a new block was reduced by 50%.
Putting this into perspective, miners received 50 Bitcoins per block initially. Post the 2020 halving, the reward stands at 6.25 Bitcoins. This is obviously a significant drop, but when viewed in light of the corresponding price changes, Bitcoin mining continues to be profitable. The reason for this is that Bitcoin halving events play a crucial role in influencing the BTC price and its appeal as a store of value.
This talk of Bitcoin halvings might all sound a bit dull, but whether mining or investing in crypto, the whole market is driven by the price of BTC and subsequently the BTC halving events.
“It’s a big deal!”
A bit about Bitcoin mining and its miners
Like with any crypto mining, Bitcoin miners play a crucial role in the Bitcoin network by verifying and recording transactions, securing the network, and adding new blocks to the blockchain. The importance of Bitcoin mining lies in maintaining the integrity of the digital currency and ensuring its decentralisation. The simplest way to think of Bitcoin mining is a process of transforming electricity into a digital currency of the future, which is why Bitcoin is often termed digital gold.
Halving events impact Bitcoin miners because they reduce the rewards that miners receive, essentially cutting their earnings in half and making Bitcoin mining less profitable. However, Bitcoin halving events also ensures the scarcity of Bitcoin, potentially increasing its long-term value and incentivising miners to continue securing the network despite reduced rewards.
The Bitcoin network and the cyclic heartbeat of cryptocurrency
The Bitcoin network is like a digital ledger where transactions are recorded and stored securely and owes its strength to these miners.
Bitcoin miners make sure everything runs smoothly and their unyielding work underpins the network’s security. As the Bitcoin halving countdown begins, miners will be bracing for change and their resolve mirrored in the robustness of the Bitcoin network.
We can think of Bitcoin halvings as a cyclic heartbeat to keep Bitcoin’s lifeblood flowing. These events shape the supply and demand between miners and the wider Bitcoin market, and with every Bitcoin halving event, the Bitcoin network matures, evolving into an entity more intricate and resilient than before.
Bull markets and bear markets
Bitcoin halving events can impact entire crypto market cycles, but several phases can occur naturally between them.
These are generally classified as:
- Bull markets: A phase where prices rise, and we see increased investor enthusiasm and positive market sentiment. During this phase, cryptocurrencies experience substantial price growth.
- Bear markets: A phase marked by falling prices, declining market sentiment, and negative investor outlook. Bear markets often follow bull markets and can lead to prolonged periods of price stagnation or decline.
The emotion that investors and Bitcoin miners feel during these periods can be quite overwhelming: total euphoria and excitement at the prospect of life-changing wealth or absolute fear and dread at the prospect of seeing wealth drop to almost zero.

The battle of bull and bear markets in crypto
Cryptocurrency markets are known for their high volatility, and Bitcoin, as its most prominent member, has seen several sharp declines over the years.
One of the most notable percentage drops in Bitcoin’s price occurred during the 2017-2018 “crypto winter”. In December 2017, the Bitcoin price peaked at almost $20K. By mid-December 2018 the price had dropped to just over $3K, that’s a price drop of around 84%.
This drop came after a significant bull run in 2017 that saw Bitcoin reach its then-all-time high of just below $20K. The decline was attributed to a combination of factors, including regulatory news, security breaches, and the burst of the initial coin offering (ICO) bubble.
But on the flip side, imagine buying into Bitcoin at the very beginning of 2021 for $25K and seeing your investment reach $60K by April 2021. That’s a whopping 60% gain or thereabouts in only 4 months. Buying into Bitcoin during October 2020 at $11.5K would have returned a virtually 80% gain by April 2021.
Impressive right? How about buying one month before the 2012 halving at $11. Then 12 months after the Bitcoin halving event, the price was roughly $1K. That’s an unbelievable +8,000% overall. This would have resulted in incredible wealth for some, but of course, Bitcoin was still in its infancy during 2012 and relatively unknown by most of the world.
Whichever way you watch your potential wealth change, it’s a potentially gruelling or ecstatic experience for those involved.
Crypto winters and the winter of 2021-2023
Bull markets are exciting, but it takes the strongest of us to remain confident through bear markets and even more so during crypto winters.
A prolonged period of crypto price decline or stagnation like the one we’re in currently is often referred to as a “crypto winter” where prices experience little to no significant upward movement and remain relatively stagnant or decline.
It is similar in concept to a “bear market“. During these periods, emotions and interest tend to plateau and many investors lose faith, believing Bitcoin is dead or failing.

Crypto winters and their impact on Bitcoin price
May 2021 to present covers two years and more, which is a very long time when you’ve invested a significant proportion of your time and/or wealth into crypto, especially as a newcomer to the space.
At a price of roughly $50K in May 2021, we’ve seen the price fall as low as $17K in December 2021 (-66% in only 7 months), with prices levelling between ~$20K and ~$30K during the 14 months of June 2022 to present. That’s still a 40% drop from May 2021 and an almost unfathomable loss for some who expected BTC prices to continue going up.
We’ll discuss the Bitcoin halving events and price patterns in more detail shortly, but first, it’s important to remember that patterns can be easily disrupted by totally unforeseen external factors, with COIVD-19 being one that all of us will remember. Proces can also be influenced, dear we say manipulated, by external influences.
Bitcoin halving dates and their impact on the BTC price
Putting external events and influences to one side, the fact remains that the Bitcoin price has historically changed the most around the Bitcoin halving dates.
You might think that with Bitcoin dating back to 2009 and so much data, we can make an accurate Bitcoin price prediction. The reality is that since Bitcoin’s inception in 2009, we’ve only had three Bitcoin halving events.
In the grand scheme of things, 10-15 years of data doesn’t give us that much to go on and patterns can change all of the time. The price action around each Bitcoin halving event has been quite different, which explains why theories can be popular one minute but dead the next.
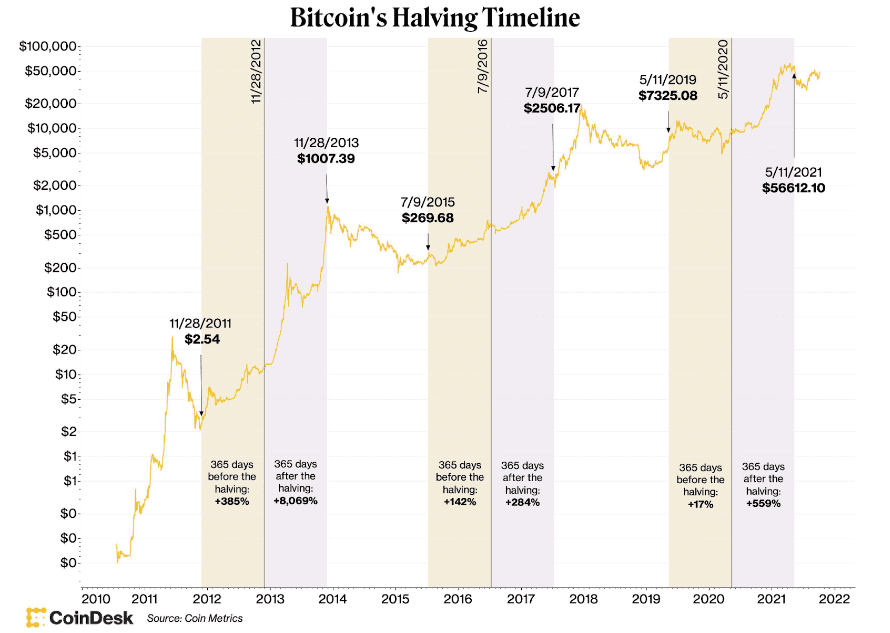
Bitcoin halving timeline and price change before and after. Source – Greyscale
So, let’s get into the meat of the article. The above chart from Greyscale very clearly shows the three Bitcoin halving events and percentage price change 365 days before and after each Bitcoin halving date but let’s look at each in more detail and examine the prices at different points in time.
Bitcoin price before halving and after halving events
The below data shows our analysis of the BTC price before and after each Bitcoin halving in USD and percentage terms. The data is slightly different to that presented by Greyscale but not by much.
2012 Halving (November 28, 2012)
BTC price before halving:
- 12 months before: Price was around $2.5.
- 6 months before: Price was around $5.
- 3 months before: Price was around $8.
- 1 month before: Price was around $11.
- Day of Bitcoin halving: Price was around $12.35.
BTC price after halving:
- 1 month after: Price was around $13.
- 3 months after: Price was around $15.
- 6 months after: Price was around $100.
- 12 months after: Price was around $1,000.
- 18 months after: Price was around $600.
- 24 months after: Price was around $378.
Percentage changes:
- 12 months before to halving: +394%
- 6 months before to halving: +147%
- 3 months before to halving: +54%
- 1 month before to halving: +12.3%
- Halving to 1 month after: +5.3%
- Halving to 3 months after: +21%
- Halving to 6 months after: +709%
- Halving to 12 months after: +8,097%
- Halving 18 months after: +4,758%
- Halving to 24 months after: +2,960.73%
2016 Halving (July 9, 2016)
BTC price before halving:
- 12 months before: Price was around $280.
- 6 months before: Price was around $430.
- 3 months after: Price was around $480.
- 1 month before: Price was around $530.
- Day of Bitcoin halving: Price was around $650.
BTC price after halving:
- 1 month after: Price was around $660.
- 3 months after: Price was around $700.
- 6 months after: Price was around $800.
- 12 months after: Price was around $2,500.
- 18 months after: Price was around $14,000.
- 24 months after: Price was around $6,600.
Percentage changes:
- 12 months before to halving: +132.1%
- 6 months before to halving: +35.42%
- 3 months before to halving: +51.2%
- 1 month before to halving: +22.6%
- Halving to 1 month after: +1.5%
- Halving to 3 months after: +7.69%
- Halving to 6 months after: +23%
- Halving to 12 months after: +285%
- Halving to 18 months after: +2,053.85%
- Halving to 24 months after: +1,145.28%
2020 Halving (May 11, 2020)
BTC price before halving:
- 12 months before: Price was around $7,300.
- 6 months before: Price was around $8,300.
- 3 months after: Price was around $7,500.
- 1 month before: Price was around $7,000.
- Day of halving: Price was around $8,600.
BTC price after halving:
- 1 month after: Price was around $9,400.
- 3 months after: Price was around $11,000.
- 6 months after: Price was around $19,000.
- 12 months after: Price was around $57,000.
- 18 months after: Price was around $43,000.
- 24 months after: Price was around $29,017.
Percentage changes:
- 12 months before to halving: +17.8%
- 6 months before to halving: +3.6%
- 3 months before to halving: +14.7%
- 1 month before to halving: +22.9%
- Halving to 1 month after: +9.3%
- Halving to 3 months after: +27.91%
- Halving to 6 months after: +121%
- Halving to 12 months after: +563%
- Halving to 18 months after: +400%
- Halving to 24 months after: +237.41%
Bitcoin price averages
Considering all of the above data, we can calculate some averages and make Bitcoin price predictions based on those averages.
This isn’t a scientific method and is overly simplistic. At this stage, we’re not taking any models into account. Much like S2F and other models, the figures presented below don’t take future external factors into account such as diminishing returns, market saturation, regulatory environments, technological innovations, and global economic conditions.
However, due to being averages of past data, the figures do account for past events/factors that have impacted the price of Bitcoin. These include market cap fluctuations and average trading price shifts.
Averages based on past Bitcoin halvings
If we take a simple average of the above data, we get:
- 12 months before to halving: +181.3%
- 6 months before to halving: +62.01%
- 3 months before to halving: +39.97%
- 1 month before to halving: +19.27%
- Halving to 1 month after: +5.37%
- Halving to 3 months after: +18.87%
- Halving to 6 months after: +284.33%
- Halving to 12 months after: +2,981.67%
- Halving to 18 months after: +2,403.95%
- Halving to 24 months after: +1,447.81%
Of course, the value (12 months after) above is overly exaggerated by Bitcoin’s phenomenal +8,097% increase 12 months after the first Bitcoin halving event.
Percentage change between Bitcoin halving dates (2012 to 2020)
We can also determine the overall Bitcoin price percentage change between each of the halving dates by looking at the price on the day of each Bitcoin halving and then comparing that to the price on the day of the next halving.
2012 to 2016:
-
- Start Price (2012 Halving): $12.35
- End Price (2016 Halving): $650
- Percentage Change: ((650−12.35)/12.35)∗100= 5,164.8%
2016 to 2020:
-
- Start Price (2016 Halving): $650
- End Price (2020 Halving): $8,600
- Percentage Change: ((8,600−650)/650)∗100 = 1,223.1%
This shows the growth in the price of Bitcoin from one halving to the next. The first interval (2012-2016) experienced a more dramatic increase compared to the second interval (2016-2020). However, both periods witnessed substantial growth.
Given the significant decrease in percentage growth from the 2012-2016 period (5,164.8%) to the 2016-2020 period (1,223.1%), it would make sense to expect a further reduction in the growth rate for the subsequent period (2020-2024).
To extrapolate the growth rate for 2020-2024, we could use the rate of decrease between the two periods:
Decrease in Growth Rate = 5,164.8−1,223.1 / 5,164.8= 76.3%
If we apply a similar decrease to the 1,223.1% growth rate for the 2020-2024 period:
Estimated Growth Rate 2020-2024 = 1,223.1% – (1,223.1% * 76.3%) = 290.4%
End of 2023 price based 290.4% of the 2020 price is $27K
Since we’re estimating the price for December 2023, which is 3 years after the 2020 halving and 4 months before the 2024 halving, we’ll consider 3/4 of the growth rate for 2020-2024.
Given that the price at the end of the Bitcoin halving in 2020 was $8,600:
Price at end of 2023 = 8,600 × (1+0.75×2.904)
Price at end of 2023 = 8,600 ×3.178 = $27,310.8
This is based on a very limited data set and the Bitcoin price in 2020, but interestingly, at the time of writing this article in September 2023, the Bitcoin price prediction of $27K appeared to be spot on.
We’re now in November 2023, and the current Bitcoin price is just over $37K. There are multiple reasons for this but the most important factor is the expected imminent approval of Bitcoin spot ETFs. For the full lowdown, please check out our other articles.
Future Bitcoin price predictions based on averages
Trying to estimate a future Bitcoin price prediction (or prediction for any asset) is uncertain. However, based on the above data, patterns observed from past Bitcoin halving events, and the subsequent calculations, we can provide an educated extrapolation using the following:
Here we’ll be using the Averaging Method and consider the average percentage changes leading up to and following the Bitcoin halvings.
We’ll start with Bitcoin’s price on 5th September 2023 of ~$26K and try to work out the best average for a predicted price at the end of 2023, 2024 and 2025.
Bitcoin price 2023 (~$36K)
For the end of 2023:
- This is approximately 4 months before the next Bitcoin halving in April 2024.
- We’ll use the average of 3 months before the next Bitcoin halving to estimate this.
Price = 26,000 * 1.3997 = $36,391.2
Bitcoin price 2024 (~$385K)
For the end of 2024:
- This is approximately 8 months after the next Bitcoin halving in April 2024.
- We’ll use a weighted average of “Bitcoin halving to 6 months after” and “Bitcoin halving to 12 months after” to estimate this.
Price = 36,391.2 * 10.5867 = $385,428.5
Bitcoin price 2025 (~$675K)
For the end of 2025:
- This is approximately 20 months after the next Bitcoin halving in April 2024.
- We’ll use a weighted average of “Bitcoin halving to 12 months after” and “Bitcoin halving to 24 months after” to estimate this.
Price = 36,391.2 * 18.5458 = $675,135.8
The application of the Averaging Method to provide a Bitcoin price prediction involves considering historical trends and employing averages of percentage changes from previous Bitcoin halving events. While this method offers a structured approach, its reliability in predicting cryptocurrency prices should be approached with caution.
All of that said, the prediction of $36,391.2 is VERY close to where we are now, with the current Bitcoin price being $37,024 on 11th November 2023.
The Averaging Method serves as a useful tool for considering potential future price trends based on historical averages.
However, due to the inherent volatility and complexity of the cryptocurrency market, predictions should be taken as informed estimates rather than certainties.
Investors and analysts should supplement such analyses with a comprehensive understanding of the broader market context and a recognition of the risks associated with using any kind of model, theory or prediction.
Future Bitcoin price predictions based on trends
To get a more refined view, we can plot the percentage changes around each halving to make Bitcoin price predictions, we can start by visualising the given data for each Bitcoin halving. In each Bitcoin price chart, we’ll plot the price of Bitcoin over time relative to the day of each halving.
Bitcoin halving 2012
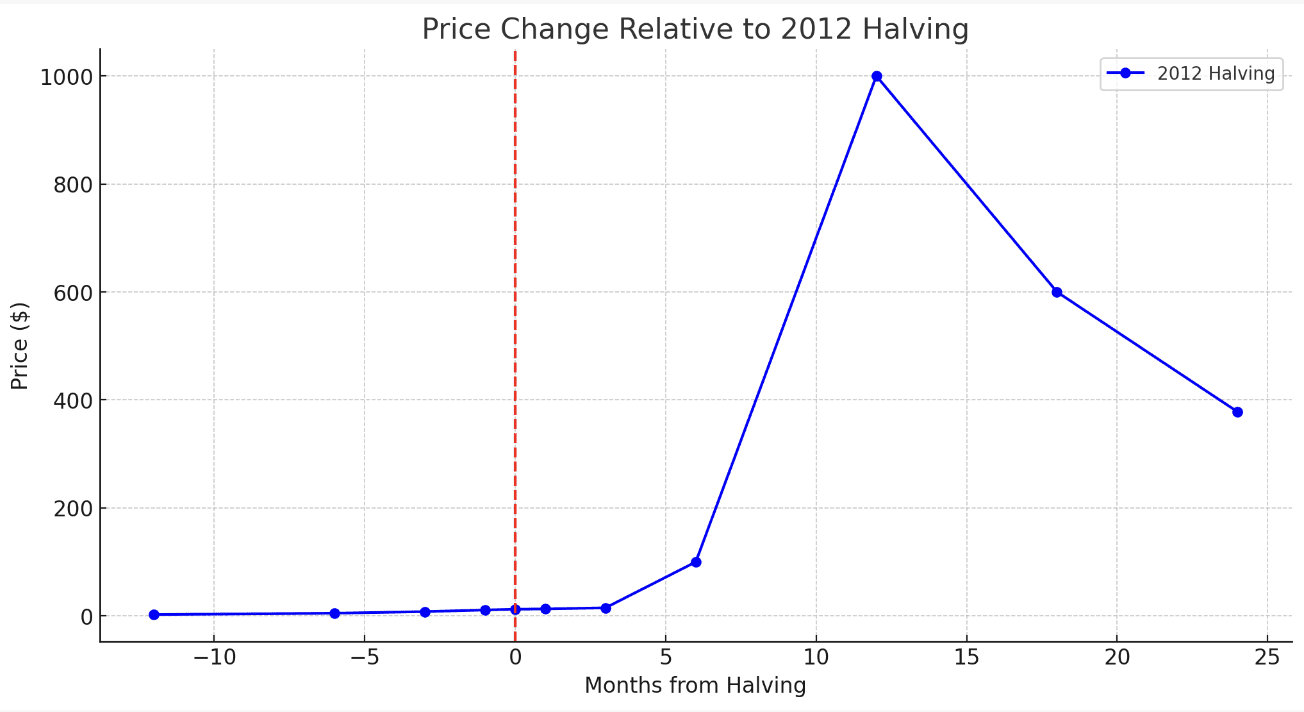
price change relative to 2012 halving – part a
The Bitcoin price chart above shows the price change relative to the 2012 halving. The vertical red dashed line indicates the day of the Bitcoin halving. As can be seen, the price of Bitcoin experienced a significant increase in the months following the halving event, with the most pronounced rise occurring 12 months after the event.
Now, let’s visualise the percentage changes for the 2012 halving over the same period.
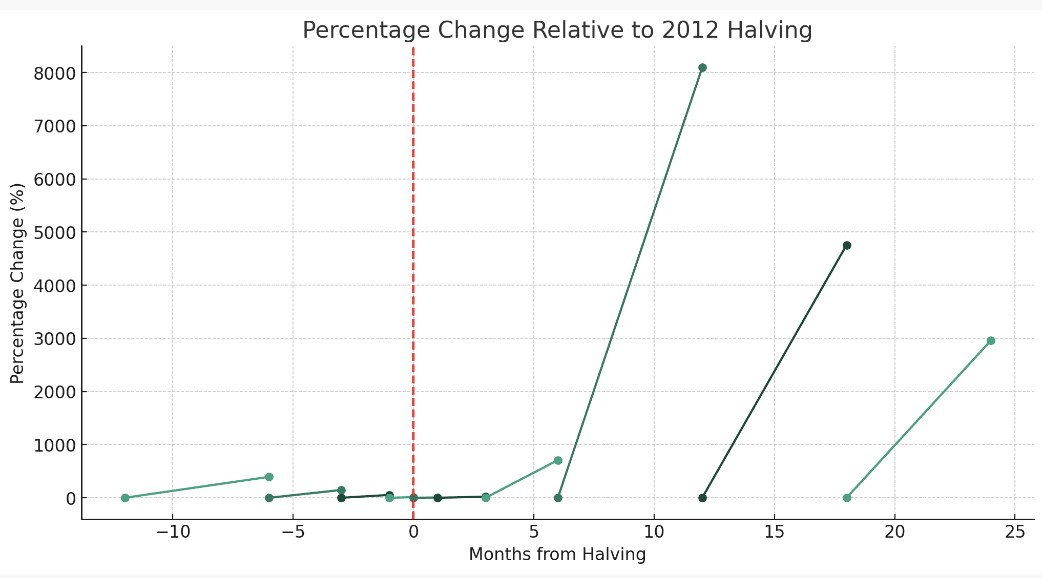
price change relative to 2012 halving – part b
The segments between markers show the rate of change from the start to the end of each time interval. For instance, the first segment represents the 394% increase from 12 months before the Bitcoin halving to the day of the halving.
2016 halving
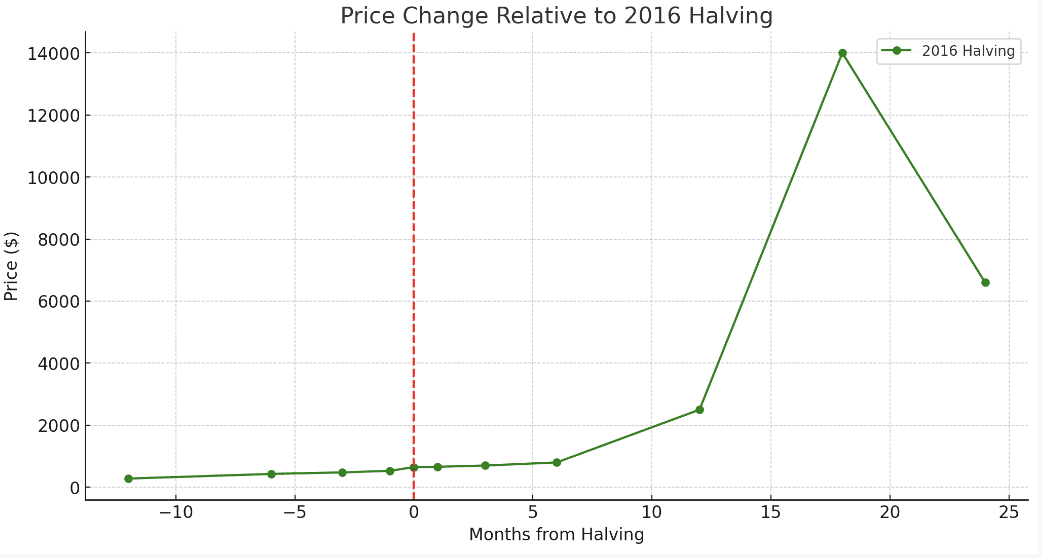
price change relative to 2016 halving – part a
This Bitcoin price chart illustrates the price evolution of Bitcoin around the time of the 2016 halving. As with the 2012 halving, a notable price increase is observed after the Bitcoin halving event, especially 18 months post-halving.
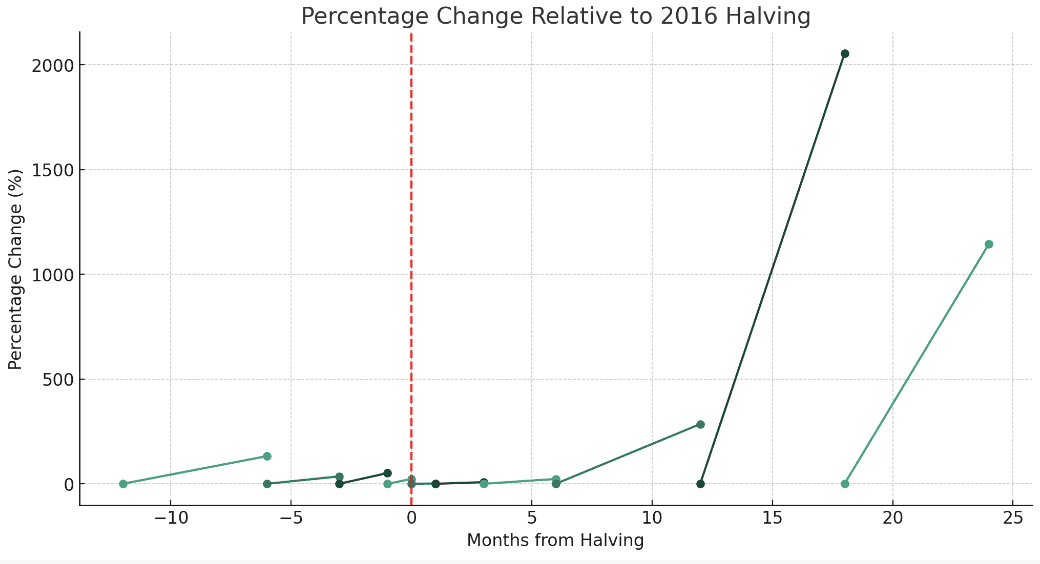
price change relative to 2016 halving – part b
The rate of change is again depicted between the markers for each time interval. A noticeable spike in price growth can be seen 18 months after the Bitcoin halving.
Bitcoin halving 2020
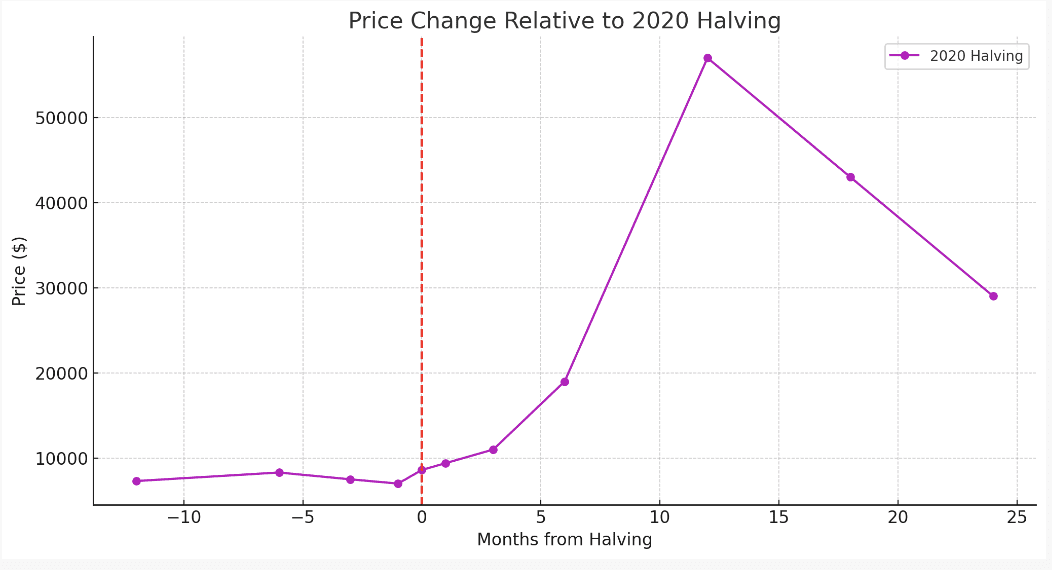
price change relative to 2020 halving – part a
The Bitcoin price chart here showcases the price trajectory of Bitcoin relating to the 2020 halving. A remarkable growth in price is evident 12 months after the Bitcoin halving, followed by a slight decline in the subsequent months.
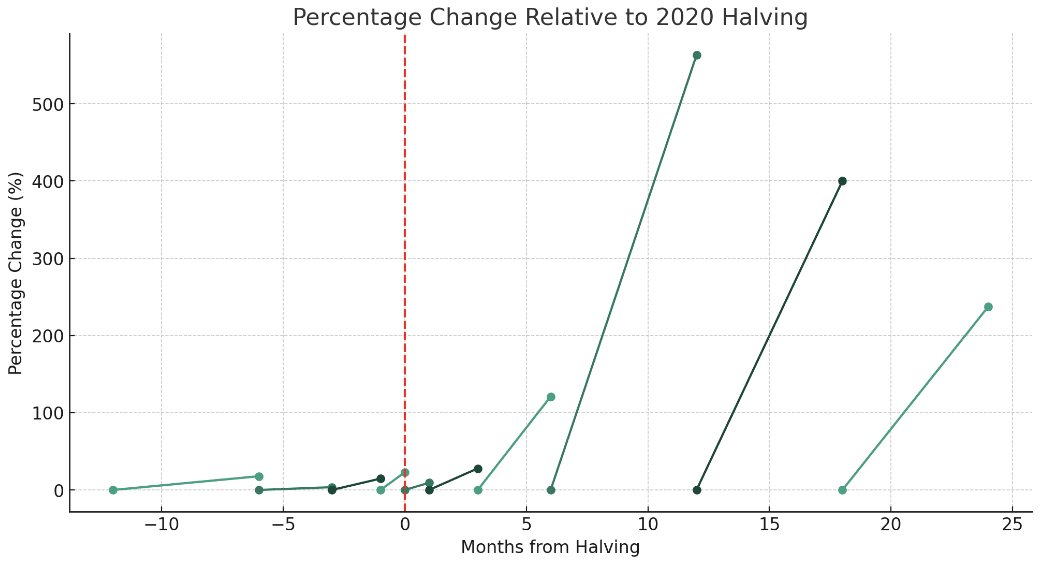
price change relative to 2020 halving – part b
This chart presents the percentage change in Bitcoin’s price around the time of the 2020 halving. The most significant growth in percentage terms occurred approximately 12 months post-halving, similar to previous Bitcoin halvings.
Bitcoin halving 2024
Although we’re not quite there yet, we can present a similar chart based on the data we have. The price prediction following the 2024 Bitcoin halving suggests almost certain BTC price rises.
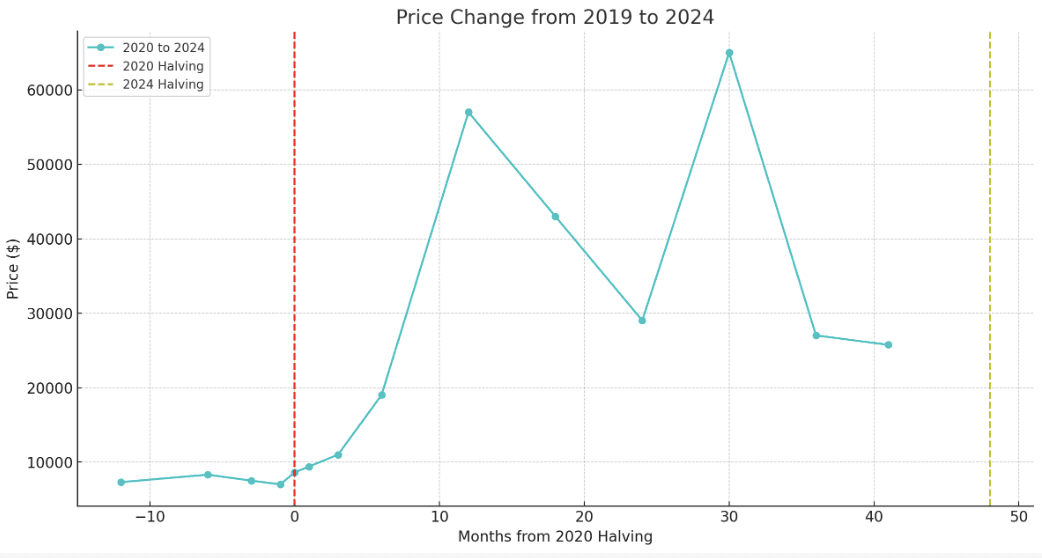
Bitcoin price trend to 2024
The above graphs shows the Bitcoin price change from the 2020 halving through to 2024 based on all of the data we have at present.
The red dashed line signifies the 2020 halving, while the yellow dashed line indicates the 2024 halving (presumed to occur in April/May, similar to the 2020 halving).
Notice has each chart displays very similar characteristics.
Polynomial regression model for 2023 ($68K) to 2025 ($147K)
Starting with Polynomial Regression, this method will allow us to fit a polynomial curve to our data and make predictions based on that curve. We’ll use the combined data from all previous Bitcoin halving events to ensure a more comprehensive regression.
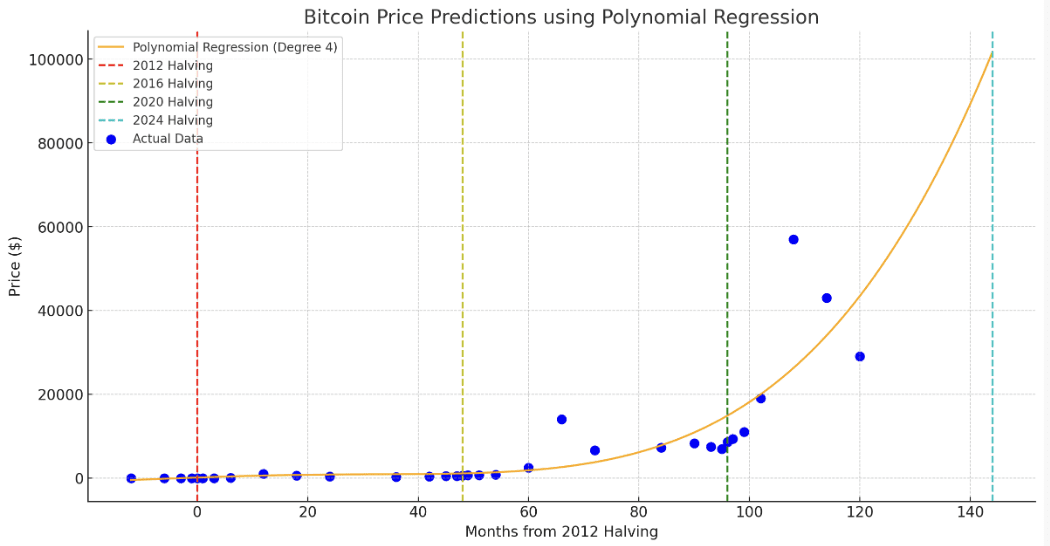
Bitcoin price prediction using the polynomial regression model
The graph illustrates the Polynomial Regression Bitcoin price forecast. The curve fits the historical data and extends BTC price predictions up to 48 months after the 2024 halving event.
Based on the Polynomial Regression we can approximate the following values:
- The BTC price prediction at the end of 2023 is approximately $67,981.35.
- The BTC price prediction at the end of 2024 is approximately $101,672.80.
- The BTC price prediction at the end of 2025 is approximately $146,539.89.
Exponential growth model for 2023 ($73K) to 2025 ($205K)
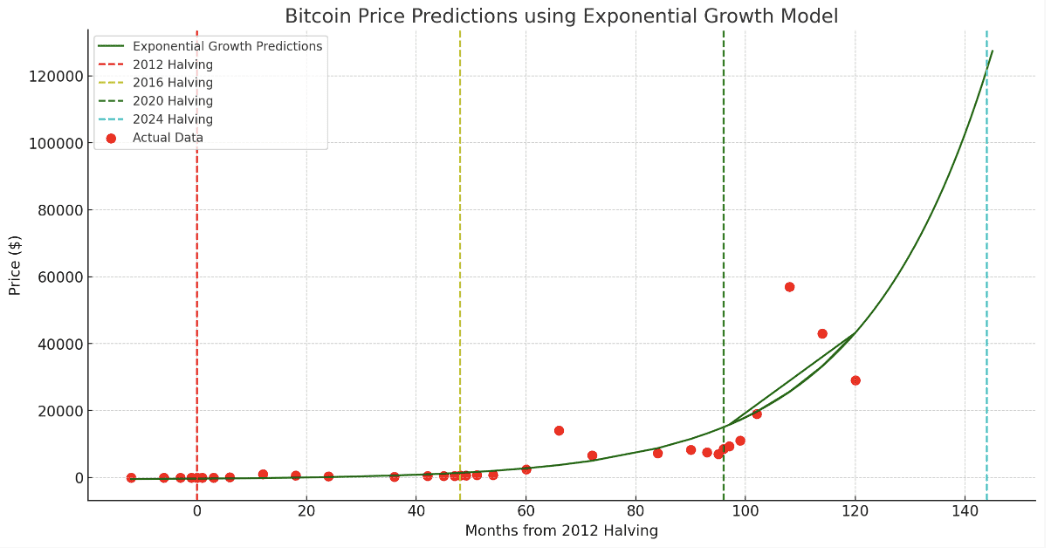
Bitcoin price prediction using the exponential growth model
This model looks very similar to the Polynomial Regression model but each have different mathematical foundations. The Exponential Growth model makes the following predictions:
- The BTC price prediction at the end of 2023 is approximately $72,706.19
- The BTC price prediction at the end of 2024 is approximately $122,025.56
- The BTC price prediction at the end of 2025 is approximately $204,529.42
Analysis of the above data (actual prices will fall somewhere between)
The Averaging Method comes very close to what the BTC price value might look like at the end of 2023. At the time of writing, the projections for 2024 and 2025 seem overly optimistic, but this could all change.
Both the Polynomial Regression and Exponential Growth models seem to capture the observed historical exponential growth of Bitcoin’s price quite well. Given the data and the nature of Bitcoin’s historical price trajectory, these two models seem to provide a more coherent view of the trend.
With a current price of $37,024, we’re some way off $67,981.35 to $72,706.19. We still have seven weeks to go, but if we see growth similar to the 36.18% within the last 30 days, this would put us at approximately $62,121.35 at year-end. Again, this seems like a highly possible scenario.
With everything above said, the coherence of a model’s Bitcoin price prediction largely depends on the nature of the data and the specific context. For Bitcoin:
- Polynomial Regression: This model was able to capture the nonlinear growth trend and provided a smooth curve that aligned well with the data points. It’s flexible and can adapt to various growth patterns.
- Exponential Growth Model: Given the exponential growth observed in Bitcoin’s early years, this model is a natural fit. It’s a bit more optimistic in its predictions, expecting the growth trend to continue aggressively.
In summary, based on the data provided and the historical trends observed, the Averaging Method, Polynomial Regression, and Exponential Growth models all provide sensible Bitcoin price predictions.
Given the data and the inherent unpredictability of cryptocurrencies, we’d expect the actual prices to likely fall somewhere below these predictions, especially for the longer-term ones like 2025.
Will 2024-2025 be the biggest Bitcoin bull run ever?
As seen above, the data estimates and BTC price predictions are varied, but they’re only heading in one direction. The question is how much of an increase we can expect and whether it will amount to the biggest bull run ever for Bitcoin.

Bitcoin Price Predictions 2023-2025
This seems unlikely given the price changes seen in Bitcoin’s early days. It seems hard-fetched to imagine an +8,000% increase again, which would put Bitcoin at ~$2,080,000 (two million eight hundred thousand dollars).
However, when we consider below, we do believe we’ll see one of the biggest Bitcoin bull runs in 2024:
- The natural price growth of Bitcoin when explored with models such as Plan B’s Stock-to-Flow S2F predicting $354K to +$1M
- Our own data and analysis predicts a BTC price anything from $147K to $675K in 2025
- Various other predications for 2024 see wider adoption of Bitcoin and crypto on a scale never seen before
There’s the potential for the price after the 2024 halving event to grow more than 2016’s 18-month post-halving value of +2,053.85%.
Is Bitcoin a bargain right now?
We’re not going to beat around the bush here as this answer depends purely on whether you’re in favour of Bitcoin and crypto in general.
Our view
The simple answer is yes if you’re an optimist. You’ll need a strong stomach and patience as timing seems to be the biggest variable here. You’ll need to be prepared to HODL for the long-term, ensure you only invest what you can afford to lose, and time any selling of Bitcoin carefully and not give in to fear.
If this is you, investing or mining cryptocurrencies like Bitcoin right now could potentially be a smart move given the current price of Bitcoin compared to various predictions, trends, models, and external factors at play. They all point upwards, with mass adoption potential, and gains of 4x to 20x very feasible for Bitcoin in the coming years.
For the pessimist of course it could be the worst possible decision. As with any crypto, it’s risky and the price has the potential to drop to zero. For those who believe Bitcoin isn’t a store of value, stay well away. Of course, the same could be said for paper money.
Plan B’s view
This tweet from PlanB provides his take on things and shows Bitcoin at a considerable discount using S2F.
His comment below certainly stacks up with the data we’ve analysed and would seem to be a winning strategy based on the past data and events surrounding the current Bitcoin price prediction:
“Buy 6 months before the Bitcoin halving and sell 18 months after”.
[Buy bitcoin 6 months before a halving and sell 18 months after a halving] has historically beaten [buy&hold]. The next halving is in April 2024 … will this strategy work again?https://t.co/9kjaCUulwb pic.twitter.com/cbO80Ym7iC
— PlanB (@100trillionUSD) July 3, 2023
The Rainbow chart ($38K to $420K by the end of 2025)
This beautiful chart shows a very compelling trend highlighting whether Bitcoin is a bargain or expensive. Right now, it’s:
Basically a fire sale!
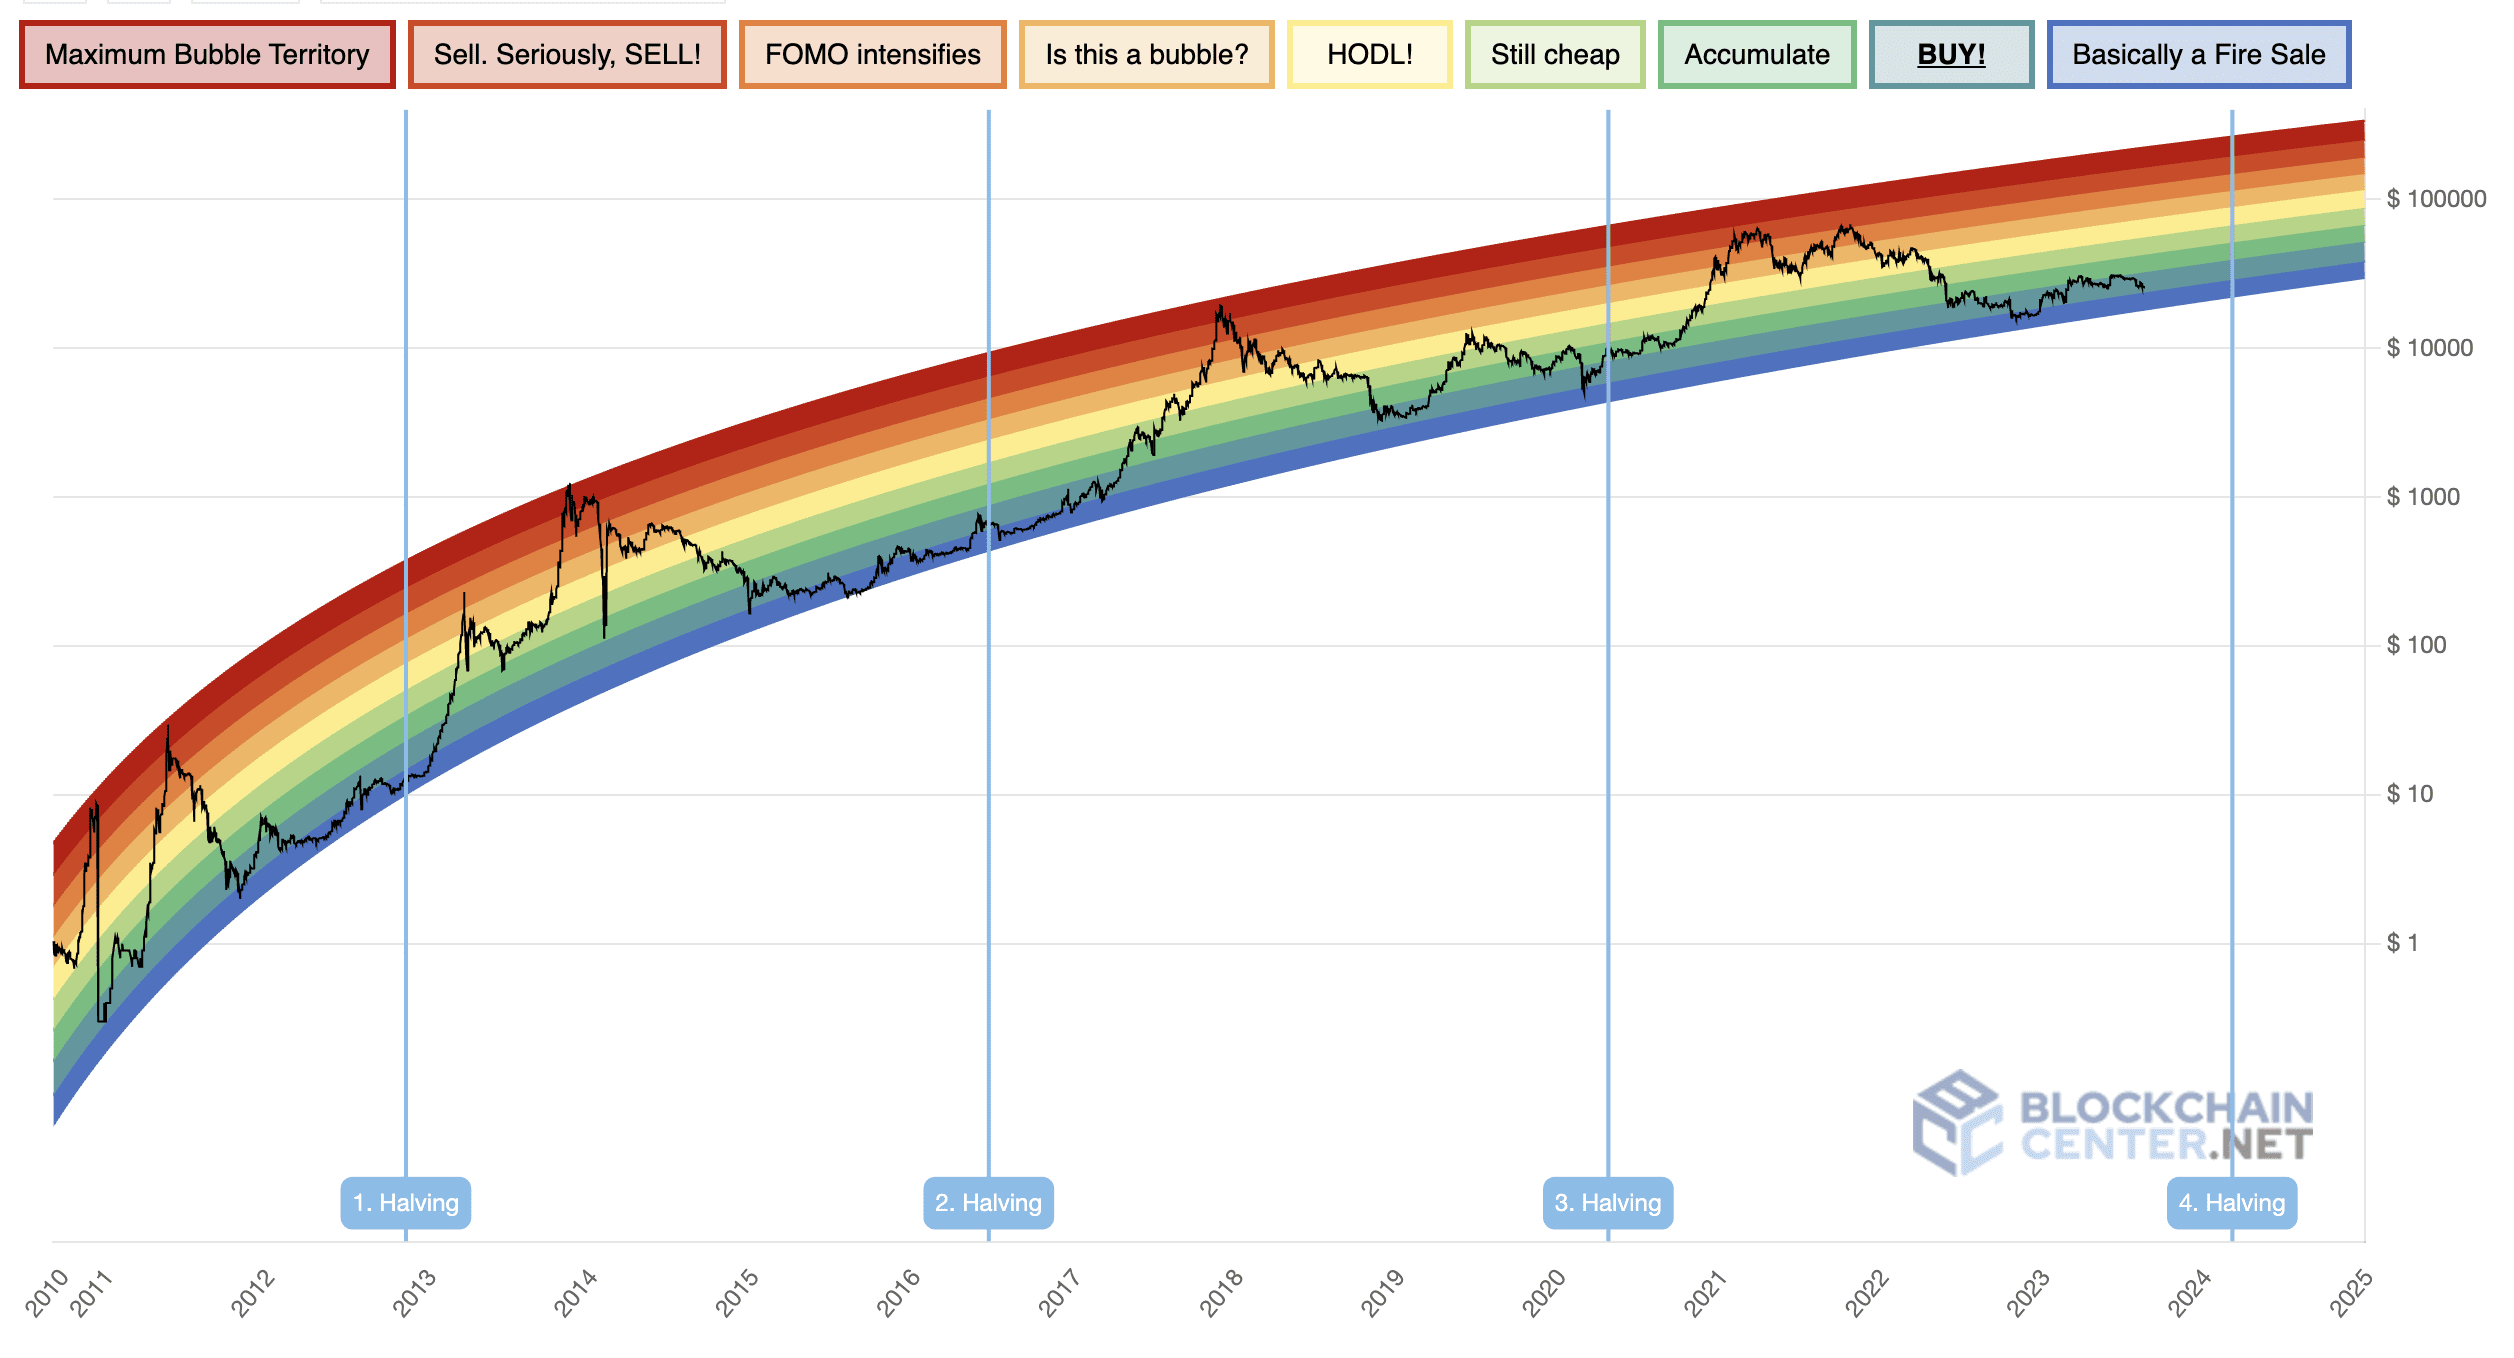
The Bitcoin Rainbow Chart. Source – Blockchain Center
The below shows the price range expected at the next Bitcoin halving with $38K to $420K by the end of 2025.
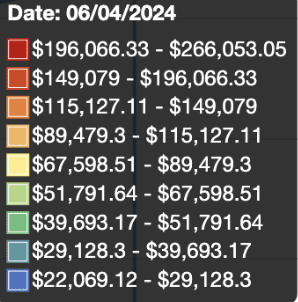
Rainbow Chart price predictions for 2024 Bitcoin halving
The 200-week moving average (200-week MA) chart
Widely considered that Bitcoin corrections tend to happen at the 200-week moving average, much like the Rainbow Model, this would imply we’re at the bottom BTC price band and heading back up.
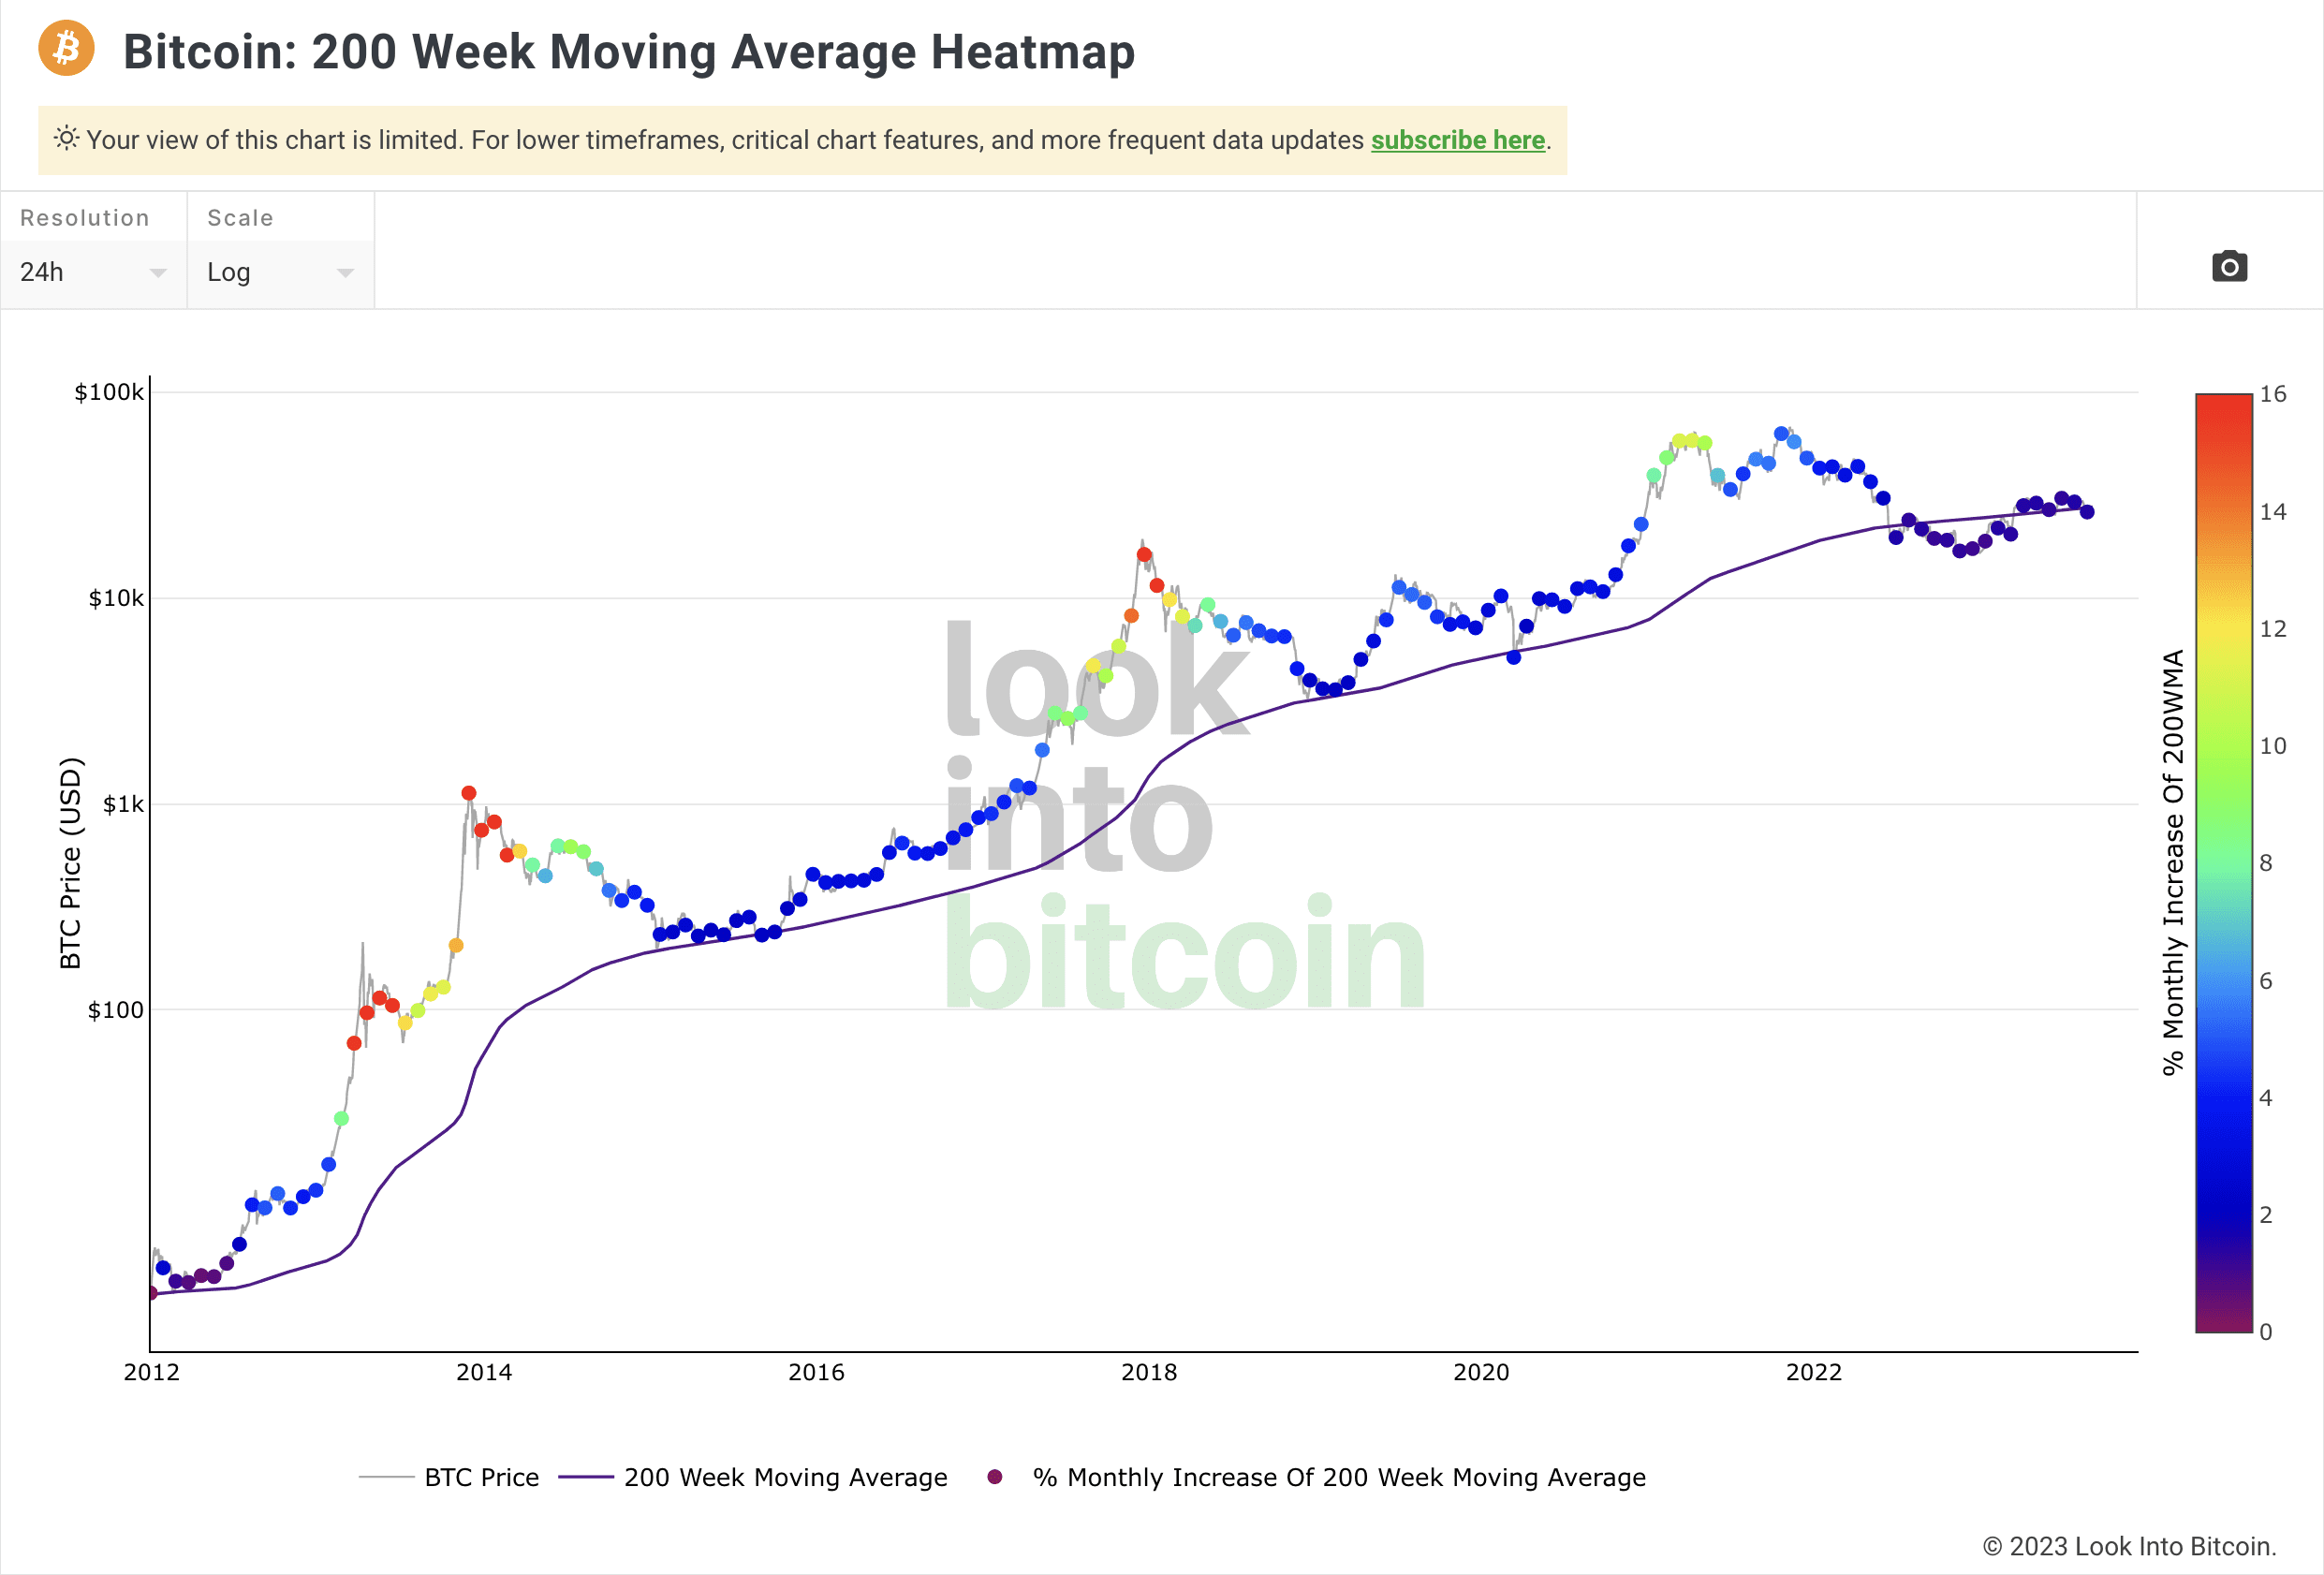
The 200-week moving average for Bitcoin 2023
This 200-week moving average (200-week MA) for Bitcoin offers an insight into its price trend by averaging its value over 200 weeks, creating a consistent line that highlights overarching market directions and possible points of support or resistance.
This metric is valued for its ability to give a broader perspective on the BTC price trajectory, minimising the impact of short-lived price swings. When the price of Bitcoin surpasses the 200-week MA, it’s typically viewed as a sign of long-term growth. This is what we are witnessing at this very moment.
All things considered
The above research, analysis, trends and even predicted external factors, all point towards a very promising future for Bitcoin and rewarding times for those who stay strong. However, if still in doubt, the safest decision is to stay away and stick with what you know.
Our prediction for 18 months after the 2024 halving ($244K)!
Looking ahead to 2024, the landscape offers both promise and uncertainty, but mainly promise. As we evaluate bitcoin price charts and price forecasts, the complexity of market dynamics becomes clear.
Although this article focuses primarily on Bitcoin halving events, we have covered other important Bitcoin price models, predictions and theories in our other articles. To understand our Bitcoin price prediction here, it’s important to read these in conjunction with this one.
All models, predictions and theories confirm a positive price change for Bitcoin following the 2024 halving event. The delay in approving Bitcoin ETFs, coupled with regulatory tensions, has the potential to either hinder or bolster investor confidence.
Current expectations however signal that approval of a Bitcoin ETF is around the corner. This report from CNN.com summarises:
“The expert consensus seems to converge between late 2023 and early 2024 for the long-awaited SEC approval of spot Bitcoin ETFs.”
This is already serving as a catalyst for prices to soar, particularly when combined with the momentum generated by the Bitcoin halving event.
The confluence of factors covered in our other articles, including stabilised interest rates, growing retail and institutional interest, and expanded adoption by countries as legal tender, all set the stage for complex price dynamics.
When taking everything into account:
Our Bitcoin price prediction for 18 months after the 2024 halving is: $244K
DISCLAIMER – Always consider consulting with a financial advisor and doing a comprehensive market analysis before making investment decisions. This article has been created for fun and is not financial advice.
The tantalising prospect of Bitcoin reaching astronomical values, potentially soaring to $500,000 after the 2024 halving is going to be debated by crypto enthusiasts and economic experts. In the world of cryptocurrency, where innovation intersects with financial evolution, the path to understanding Bitcoin’s future remains as intricate as ever.
The 2024 Bitcoin halving date stands as a pivotal milestone in shaping the trajectory of Bitcoin’s valuation. Historical data suggests that Bitcoin’s price trajectory post-halving has been consistently positive. With halvings reducing the rate of new Bitcoin issuance, supply scarcity tends to drive demand, leading to price appreciation.
All of the data points towards Bitcoin’s price going up and everybody involved in the crypto space has the potential to benefit from this.
As we look from 2023 to 2025, the convergence of the 2024 Bitcoin halving, external events, and predictive models, we can see a trend. Each halving’s impact on Bitcoin’s price progression offers insight, with patterns that intertwine the past with analysis to help predict the future. As the Bitcoin halving countdown continues, the crypto saga remains a captivating story of possibility with many possibilities in store.
It’s not just Bitcoin though, this will have much wider implications for crypto ecosystem and notably the world’s second-largest cryptocurrency, Ethereum. In the end, it is our collective journey that will shape the destination as the world watches Bitcoin’s narrative unfold in the years to come.
Last modified on: July 10, 2025
Latest Posts

GPU Mining, ASICs & Decentralisation Explained
IntroductionMining cryptocurrency has become a popular way to participate in the crypto and blockchain space while...

Basic Economics & Cryptocurrency Valuation
Why I've Written This Article? One of the most common, and most frustrating, objections (misconceptions) that I hear...

About CryptosRUs and Into the Cryptoverse
This post exploring CryptosRUs vs Into the Cryptoverse for free crypto advice is a little different to others we...

From Everyday People & General Adoption to the Bitcoin Elites: Who Will Benefit the Most?
IntroductionOn 6th September 2023, we published a massive article titled ‘Detailed Analysis of Projected Bitcoin...
Contact us to order your crypto mining rig today
Address
Opace Ltd t/a Crypto Mining Solutions, Park House, Bristol Rd South, Rubery, Birmingham, West Midlands, B45 9AH. UK
Phone
0845 017 7661

I’ve heard of burning crypto, are Bitcoin halvings the same thing? What’s the advantages over just burning crypto tokens based on demand…
Bitcoin halvings and burning crypto are different as the halving events are design to reduce the reward for mining new bitcoins, making them less common over time, while burning crypto involves permanently removing tokens from circulation. The other point to note is that the halvings are designed and occur periodically, specifically every four years, as part of Bitcoin’s design to control inflation. Burning crypto happens when the token’s owner chooses to permanently remove a certain amount from circulation, which isn’t bound by a set schedule necessarily. That said, both help with increasing scarcity and potentially driving up value.
I dont buy into the hype surrounding Bitcoin halvings it feels like an orchestrated scheme to control prices and keep everyone guessing
Hi Emir, your opinion is valid but it’s important to consider that halvings are an intentional part pf Bitcoin’s design to help ensure it’s scarcity over time. By reducing the creation of new coins, this also reduces inflation over time, i.e. the polar opposite to the current situation we are in with fiat currency and money printing.
Good article but Bitcoin doesn’t need any halvings, it’s price will moon anyway!
I think you’re missing the whole point of Bitcoin. It’s perceived price and inherent value are based on its scarcity and it not being subject to inflation or money printing like traditional fiat currency. Without the halving events, Bitcoin would still have advantages over traditional currency but there’s no way it’s value/price would increase to the extent that it’s projected to at the moment.